What to do about outliers?
The most recent assignment in my BUS 430 class was on simple linear regression. In some of the data sets, there are data points that seem to be inconsistent with the bulk of the data. One student called this to my attention and asked if he should just ignore those data points because they were “obviously a mistake.” His comment reminded me that in an earlier assignment, we had discussed briefly using a box plot software tool to identify outliers, but we had not discussed what to do about them.
When dealing with just two variables, it is quick and easy to make a scatter plot and inspect it for data points that do not follow the trend of the rest of the data. In the scatter plot below, we can see just such a data point in the lower right.
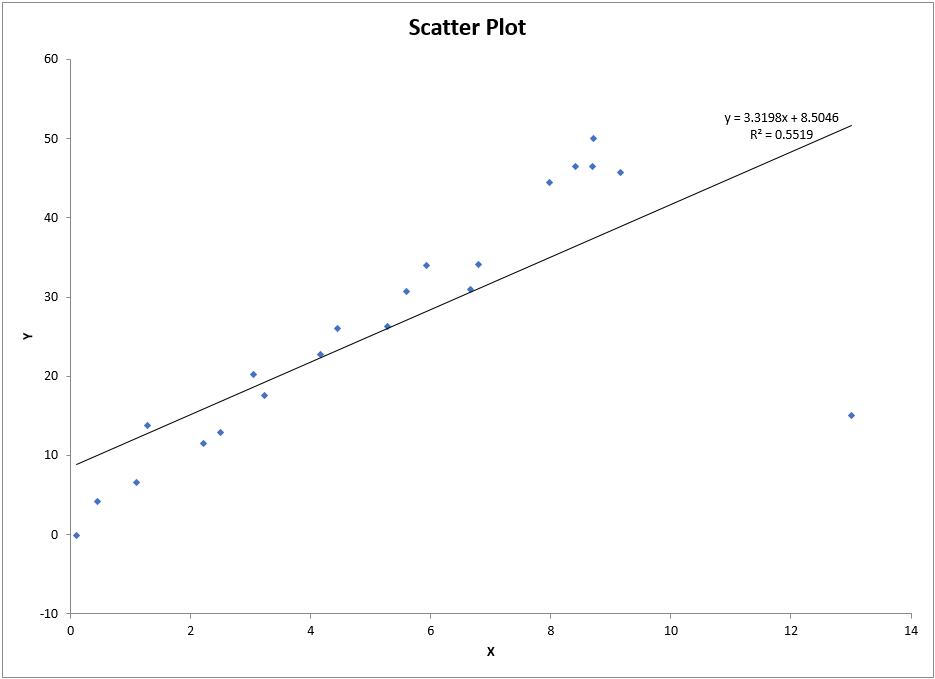
But using a box plot does not identify this point as an outlier in either the x or y axis:What to do about outliers?